For Immediate Release
November 16, 2021
Contact: Yating Campbell
Office of Public Affairs
916-327-8988
Second Quarter 2021 Surge in Taxable Sales
$216.8 Billion Boosts State and Local Communities
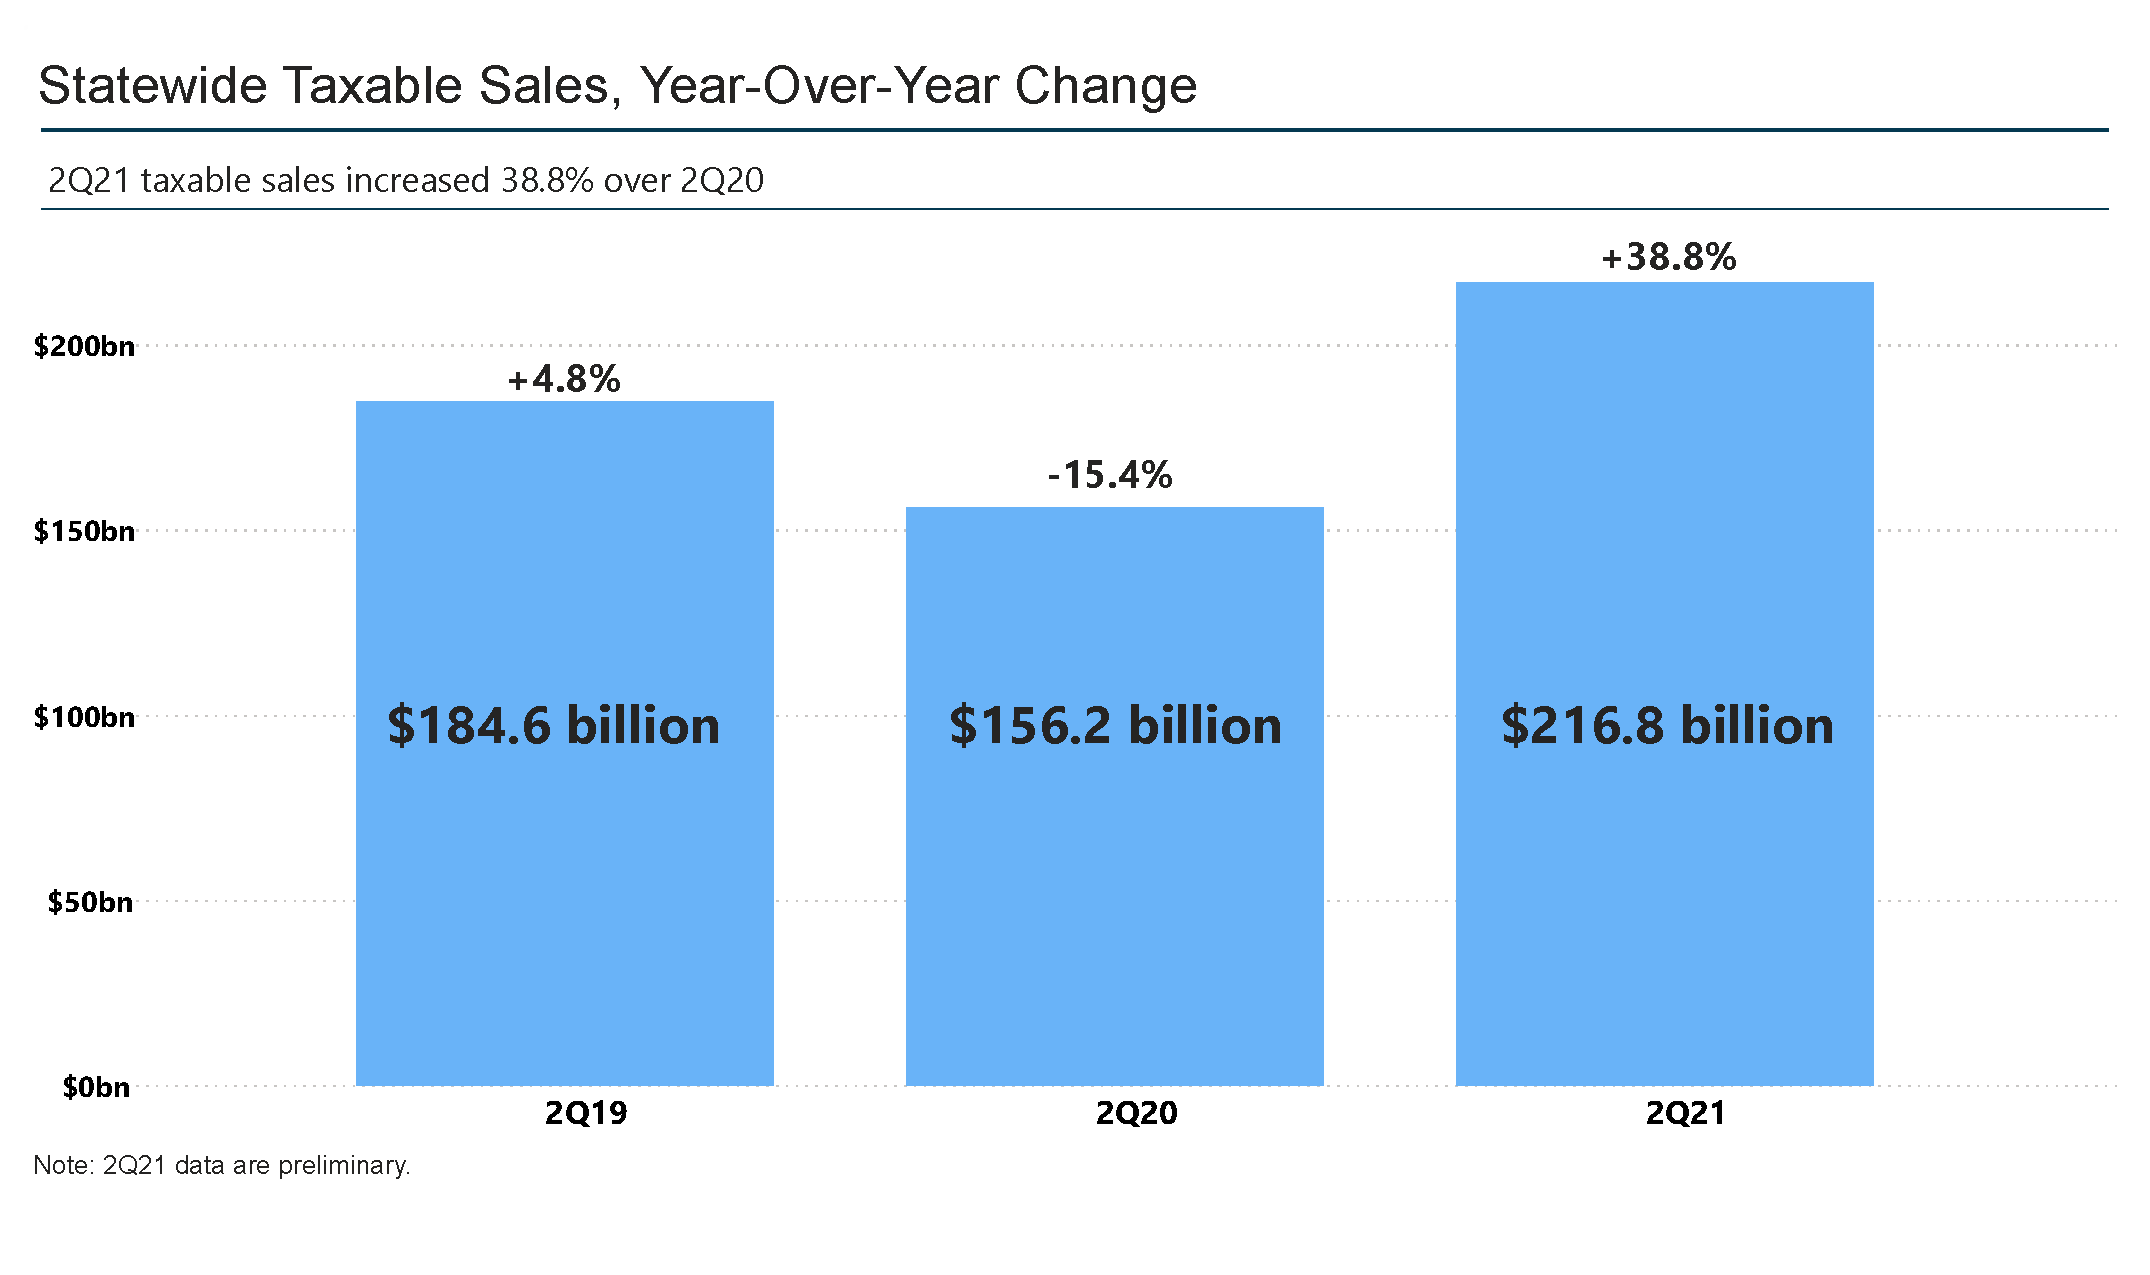
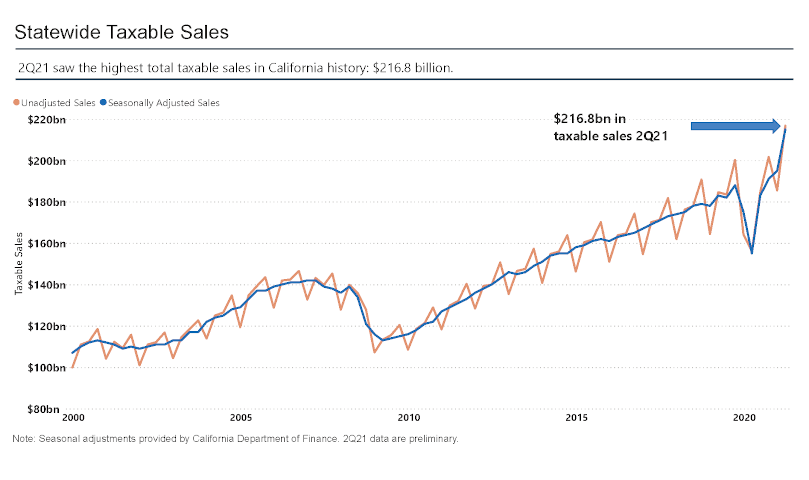
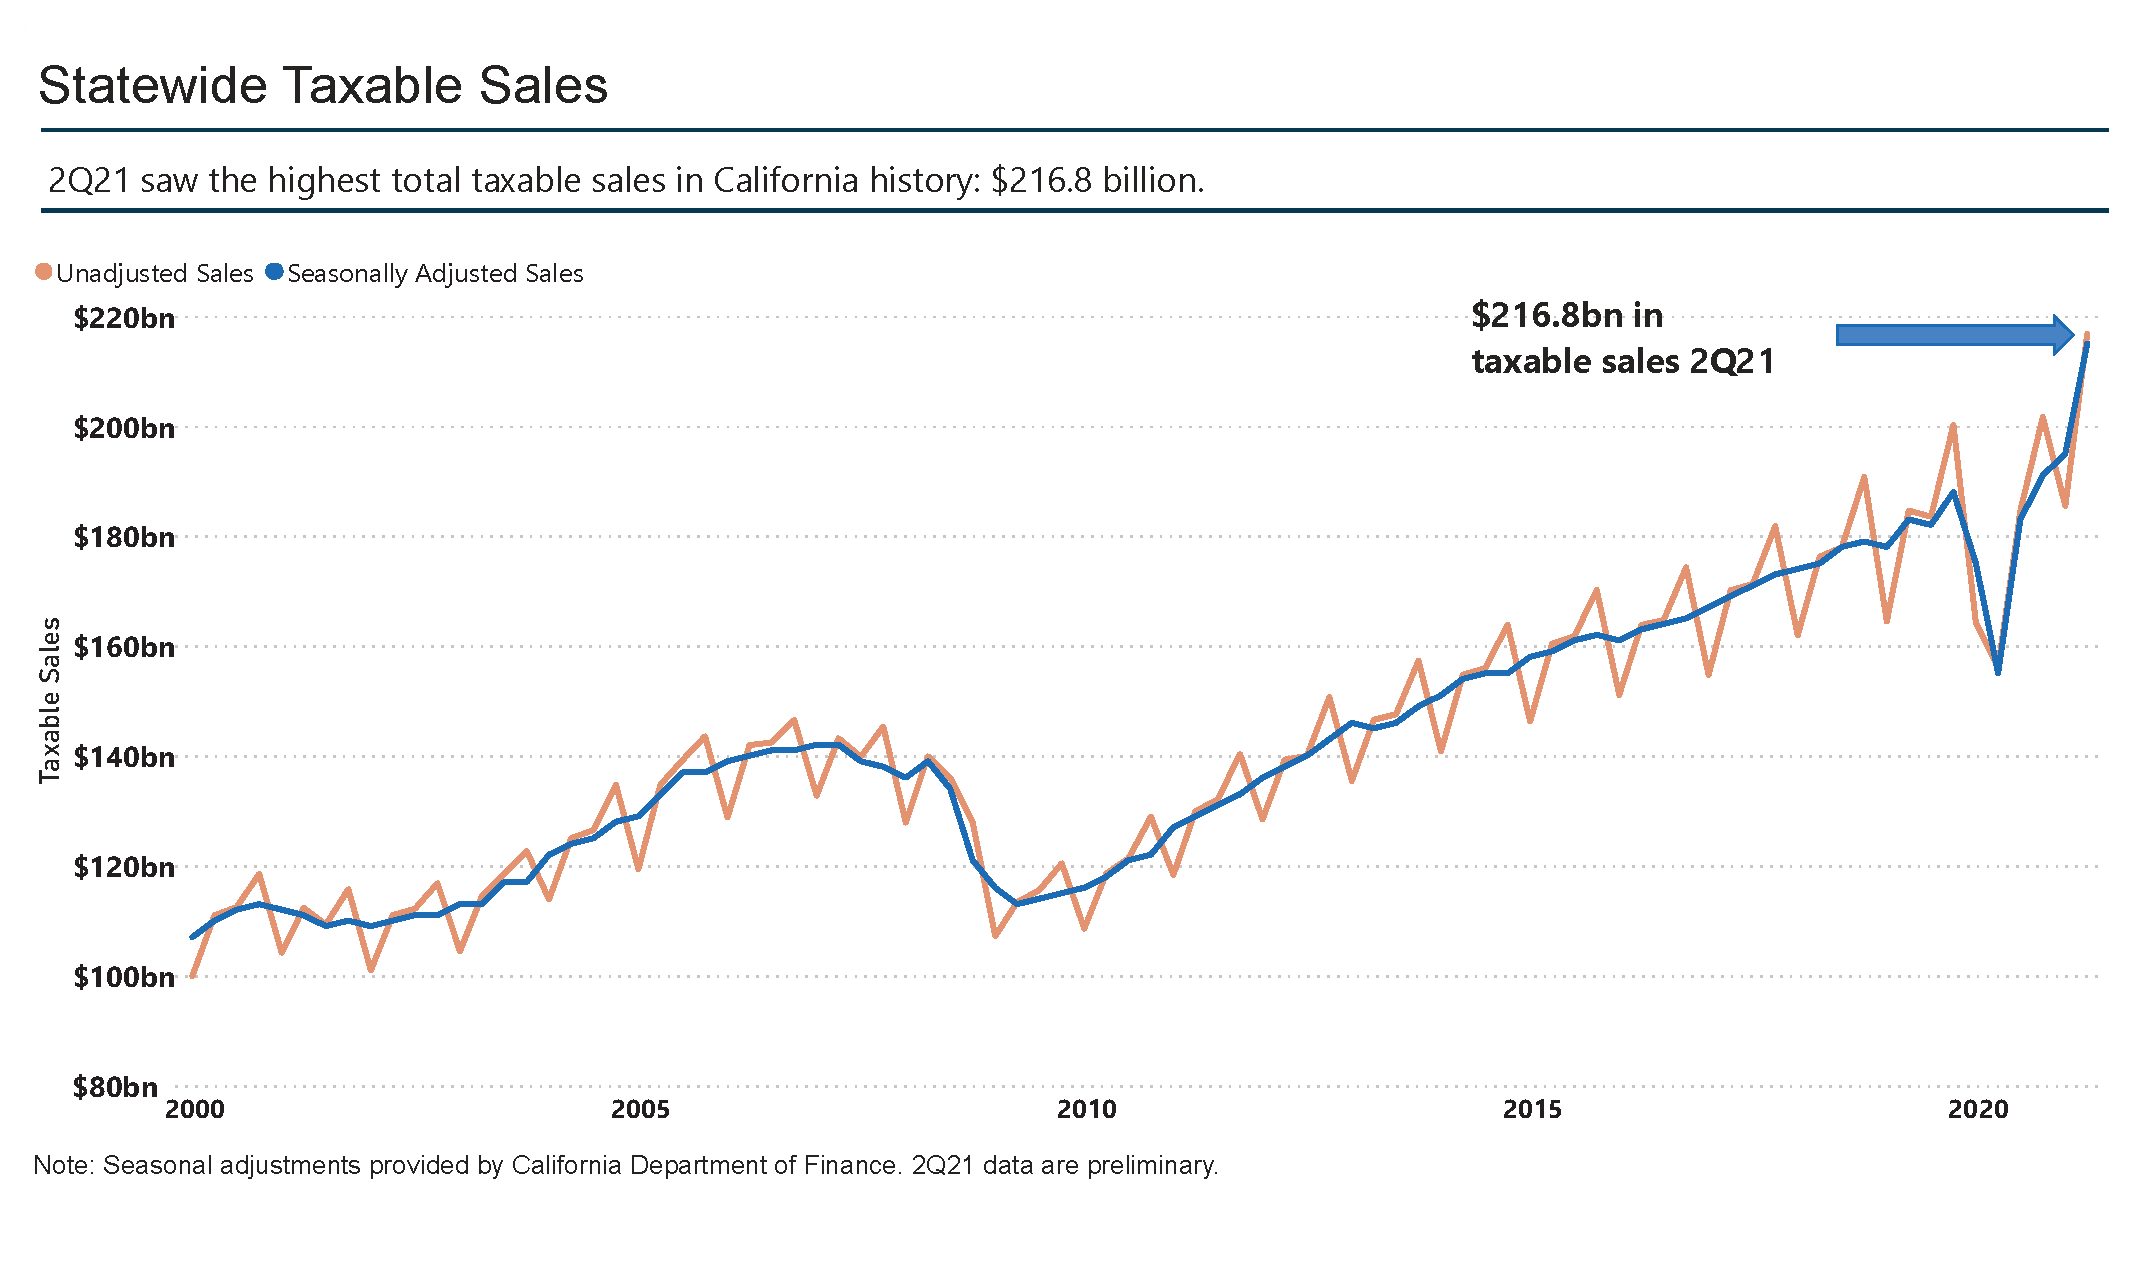
Sacramento – California businesses reported a record high of $216.8 billion in taxable sales during the second quarter of 2021 (2Q21), increasing 38.8% over the same period last year and 17.4% from the pre-pandemic second quarter of 2019 (2Q19), reports the California Department of Tax and Fee Administration (CDTFA).
“This is positive news for California's economy and a sign that business owners found creative ways to adapt during a difficult year,” said California Department of Tax and Fee Administration Director Nick Maduros. “An increase in taxable sales results in additional tax dollars going back to our communities to provide essential services such as transportation, public safety, and health services programs.”
Taxable sales in the second quarter of 2020, during the depths of the pandemic, were $156.2 billion. In 2019, second quarter taxable sales were $184.6 billion.

Increases in taxable sales varied by industry during the second-quarter months of April, May, and June. Clothing stores saw the most significant increase in taxable sales when compared to 2Q20 at 144.5%; food services and drinking places, which includes restaurants, bars, and food trucks, saw an 81.1% increase in taxable sales; and gasoline stations reported a 77.8% increase. When compared to pre-pandemic levels of 2Q19, furniture and home furnishing stores saw the highest increase at 27.9%; building material, garden equipment, and supply stores saw a 26.8% increase from pre-pandemic levels. Despite the increases, some industries, such as food services and drinking places and gasoline stations, still have not rebounded to pre-pandemic levels.
| Select Industry Highlights | Taxable Sales 2Q19 | Taxable Sales 2Q20 | Taxable Sales 2Q21 | Percent change 2Q20 to 2Q21 | Percent change 2Q19 to 2Q21 |
|---|---|---|---|---|---|
| Clothing and clothing accessories stores | $10,421,242,275 | $4,822,146,701 | $11,788,471,155 | 144.5% | 13.1% |
| Food services and drinking places | $22,777,219,578 | $12,348,097,303 | $22,356,561,674 | 81.1% | -1.8% |
| Gasoline stations | $14,598,083,722 | $7,882,536,415 | $14,017,378,109 | 77.8% | -4.0% |
| Furniture and home furnishing stores | $3,194,352,631 | $2,668,985,145 | $4,086,034,963 | 53.1% | 27.9% |
| Motor vehicle and parts dealers | $22,635,691,224 | $19,644,600,910 | $28,139,793,796 | 43.2% | 24.3% |
| Sporting goods, hobby, musical instruments, and bookstores | $2,499,677,809 | $2,066,810,169 | $2,811,095,101 | 36.0% | 12.5% |
| Electronics and appliance stores | $4,249,692,297 | $3,695,857,833 | $4,759,159,339 | 28.8% | 12.0% |
| Health and personal care stores | $3,827,998,938 | $3,524,764,595 | $4,406,443,822 | 25.0% | 15.1% |
| Building material, garden equipment, and supply stores | $10,927,127,002 | $12,312,127,035 | $13,860,590,465 | 12.6% | 26.8% |
| Food and beverage stores | $7,456,768,521 | $7,740,217,184 | $8,210,417,778 | 6.1% | 10.1% |
Taxable sales reflect sales of items subject to sales or use tax reported by businesses on returns filed with CDTFA. The sales noted in the table above have not been adjusted for inflation. The last decrease in taxable sales occurred during the Great Recession of 2008, and economic activity took four years to reach pre-recession numbers. Recovery from the pandemic has been much quicker, with taxable sales recovering in less than one year.
Additional information on taxable sales by cities, counties, and industries is available in CDTFA's Open Data Portal. The data visualization tool allows users to search for specific datasets; export data into multiple formats; customize charts in pie, line, and bar formats; or use a map to pinpoint a city or county.
The California Department of Tax and Fee Administration (CDTFA) administers California's sales and use, fuel, tobacco, alcohol, and cannabis taxes, as well as a variety of other taxes and fees that fund specific state programs. CDTFA-administered programs account for more than $73 billion annually, which in turn supports local essential services such as transportation, public safety and health, libraries, schools, social services, and natural resource management programs through the distribution of tax dollars going directly to local communities.